Rong-Hao Liang
ACM TEI ‘20: ACM Designing Interactive Systems Conference 2020
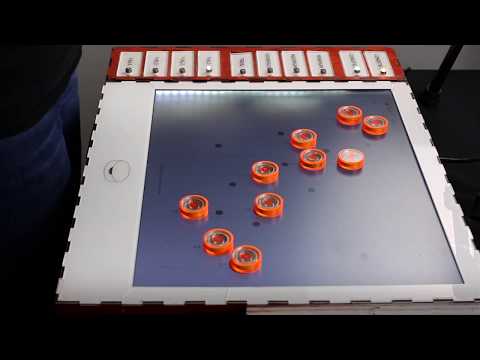
CoDa: Collaborative Data Interpretation Through an Interactive Tangible Scatterplot
Annemiek Veldhuis, Rong-Hao Liang, Tilde Bekker
TU Eindhoven
Video
Abstract
Tangibles can model abstract structures. One educational subject where this can be utilized is instruction on data visualization inter- pretation. Data physicalizations, tangible representations of data, offer graspable handles for the users to manipulate data visualiza- tions directly so that they can better understand what information they hold. However, investigations on the applicability of interac- tive data physicalizations in educational settings are still sparse. In this paper, we explore how students reason with an interactive tangible scatterplot through a collaborative data interpretation tool, CoDa. We report the design, development, and the user experiences in an exploratory study where 11 students, in groups of 2 to 4, completed a data analysis task with CoDa. The qualitative results show insights in the process of data interpretation, how interaction with the tangibles influenced these data interpretations, how the system aided collaboration and, overall user experience. We believe the results and implications offer a step towards nurturing future educational applications on interactive data physicalizations.
Keywords
Data physicalization, Education, Collaborative analysis, InfoVis.
Cite this work (ACM)
Annemiek Veldhuis, Rong-Hao Liang, and Tilde Bekker. 2020. CoDa: Collaborative Data Interpretation Through an Interactive Tangible Scatterplot. In <i>Proceedings of the Fourteenth International Conference on Tangible, Embedded, and Embodied Interaction</i> (<i>TEI '20</i>). Association for Computing Machinery, New York, NY, USA, 323–336. DOI:https://doi.org/10.1145/3374920.3374934
Cite this work (Bibtex)
@inproceedings{10.1145/3374920.3374934,
author = {Veldhuis, Annemiek and Liang, Rong-Hao and Bekker, Tilde},
title = {CoDa: Collaborative Data Interpretation Through an Interactive Tangible Scatterplot},
year = {2020},
isbn = {9781450361071},
publisher = {Association for Computing Machinery},
address = {New York, NY, USA},
url = {https://doi.org/10.1145/3374920.3374934},
doi = {10.1145/3374920.3374934},
abstract = {Tangibles can model abstract structures. One educational subject where this can be utilized is instruction on data visualization inter- pretation. Data physicalizations, tangible representations of data, offer graspable handles for the users to manipulate data visualiza- tions directly so that they can better understand what information they hold. However, investigations on the applicability of interac- tive data physicalizations in educational settings are still sparse. In this paper, we explore how students reason with an interactive tangible scatterplot through a collaborative data interpretation tool, CoDa. We report the design, development, and the user experiences in an exploratory study where 11 students, in groups of 2 to 4, completed a data analysis task with CoDa. The qualitative results show insights in the process of data interpretation, how interaction with the tangibles influenced these data interpretations, how the system aided collaboration and, overall user experience. We believe the results and implications offer a step towards nurturing future educational applications on interactive data physicalizations.},
booktitle = {Proceedings of the Fourteenth International Conference on Tangible, Embedded, and Embodied Interaction},
pages = {323–336},
numpages = {14},
keywords = {collaborative analysis, education, information visualization, data physicalization, tangible interaction},
location = {Sydney NSW, Australia},
series = {TEI '20}
}